


Finansnyt
Posted af John Yde, 16/04/2020

Comparitech har undersøgt graden af internet censur rundt om i verden. I artiklen vises flere kort, hvor man kan se hvilket restriktioner, de enkelte lande har indført.
Klik på verdenskortet herover for at blive dirigeret til artiklen eller klik på linket herunder:
Comparitech har undersøgt graden af internet censur rundt om i... Læs merePosted af John Yde, 16/04/2020

Bank of Canada fastholdt som ventet renten på 0,25% (den hvide kurve) efter gårsdagens rentemøde. Inflationen står iflg. seneste måling ved 2,15%, men det er for februar, og den vil sandsynligvis være lavere i marts.
I forbindelse med gårsdagens rentemøde udsendte banken sin pengepolitiske rapport for april. I videoen herunder gennemgås de vigtigste forhold, mens hele rapporten kan downloades ved at klikke på billedet nederst:


Posted af John Yde, 14/04/2020
Den Internationale Monetære Fond (IMF) har udsendt World Economic Outlook, som advarer om den værste økonomiske situation siden depressionen i 1930’erne. Corona krisen kan betyde, at de fleste økonomier skrumper med 5%.
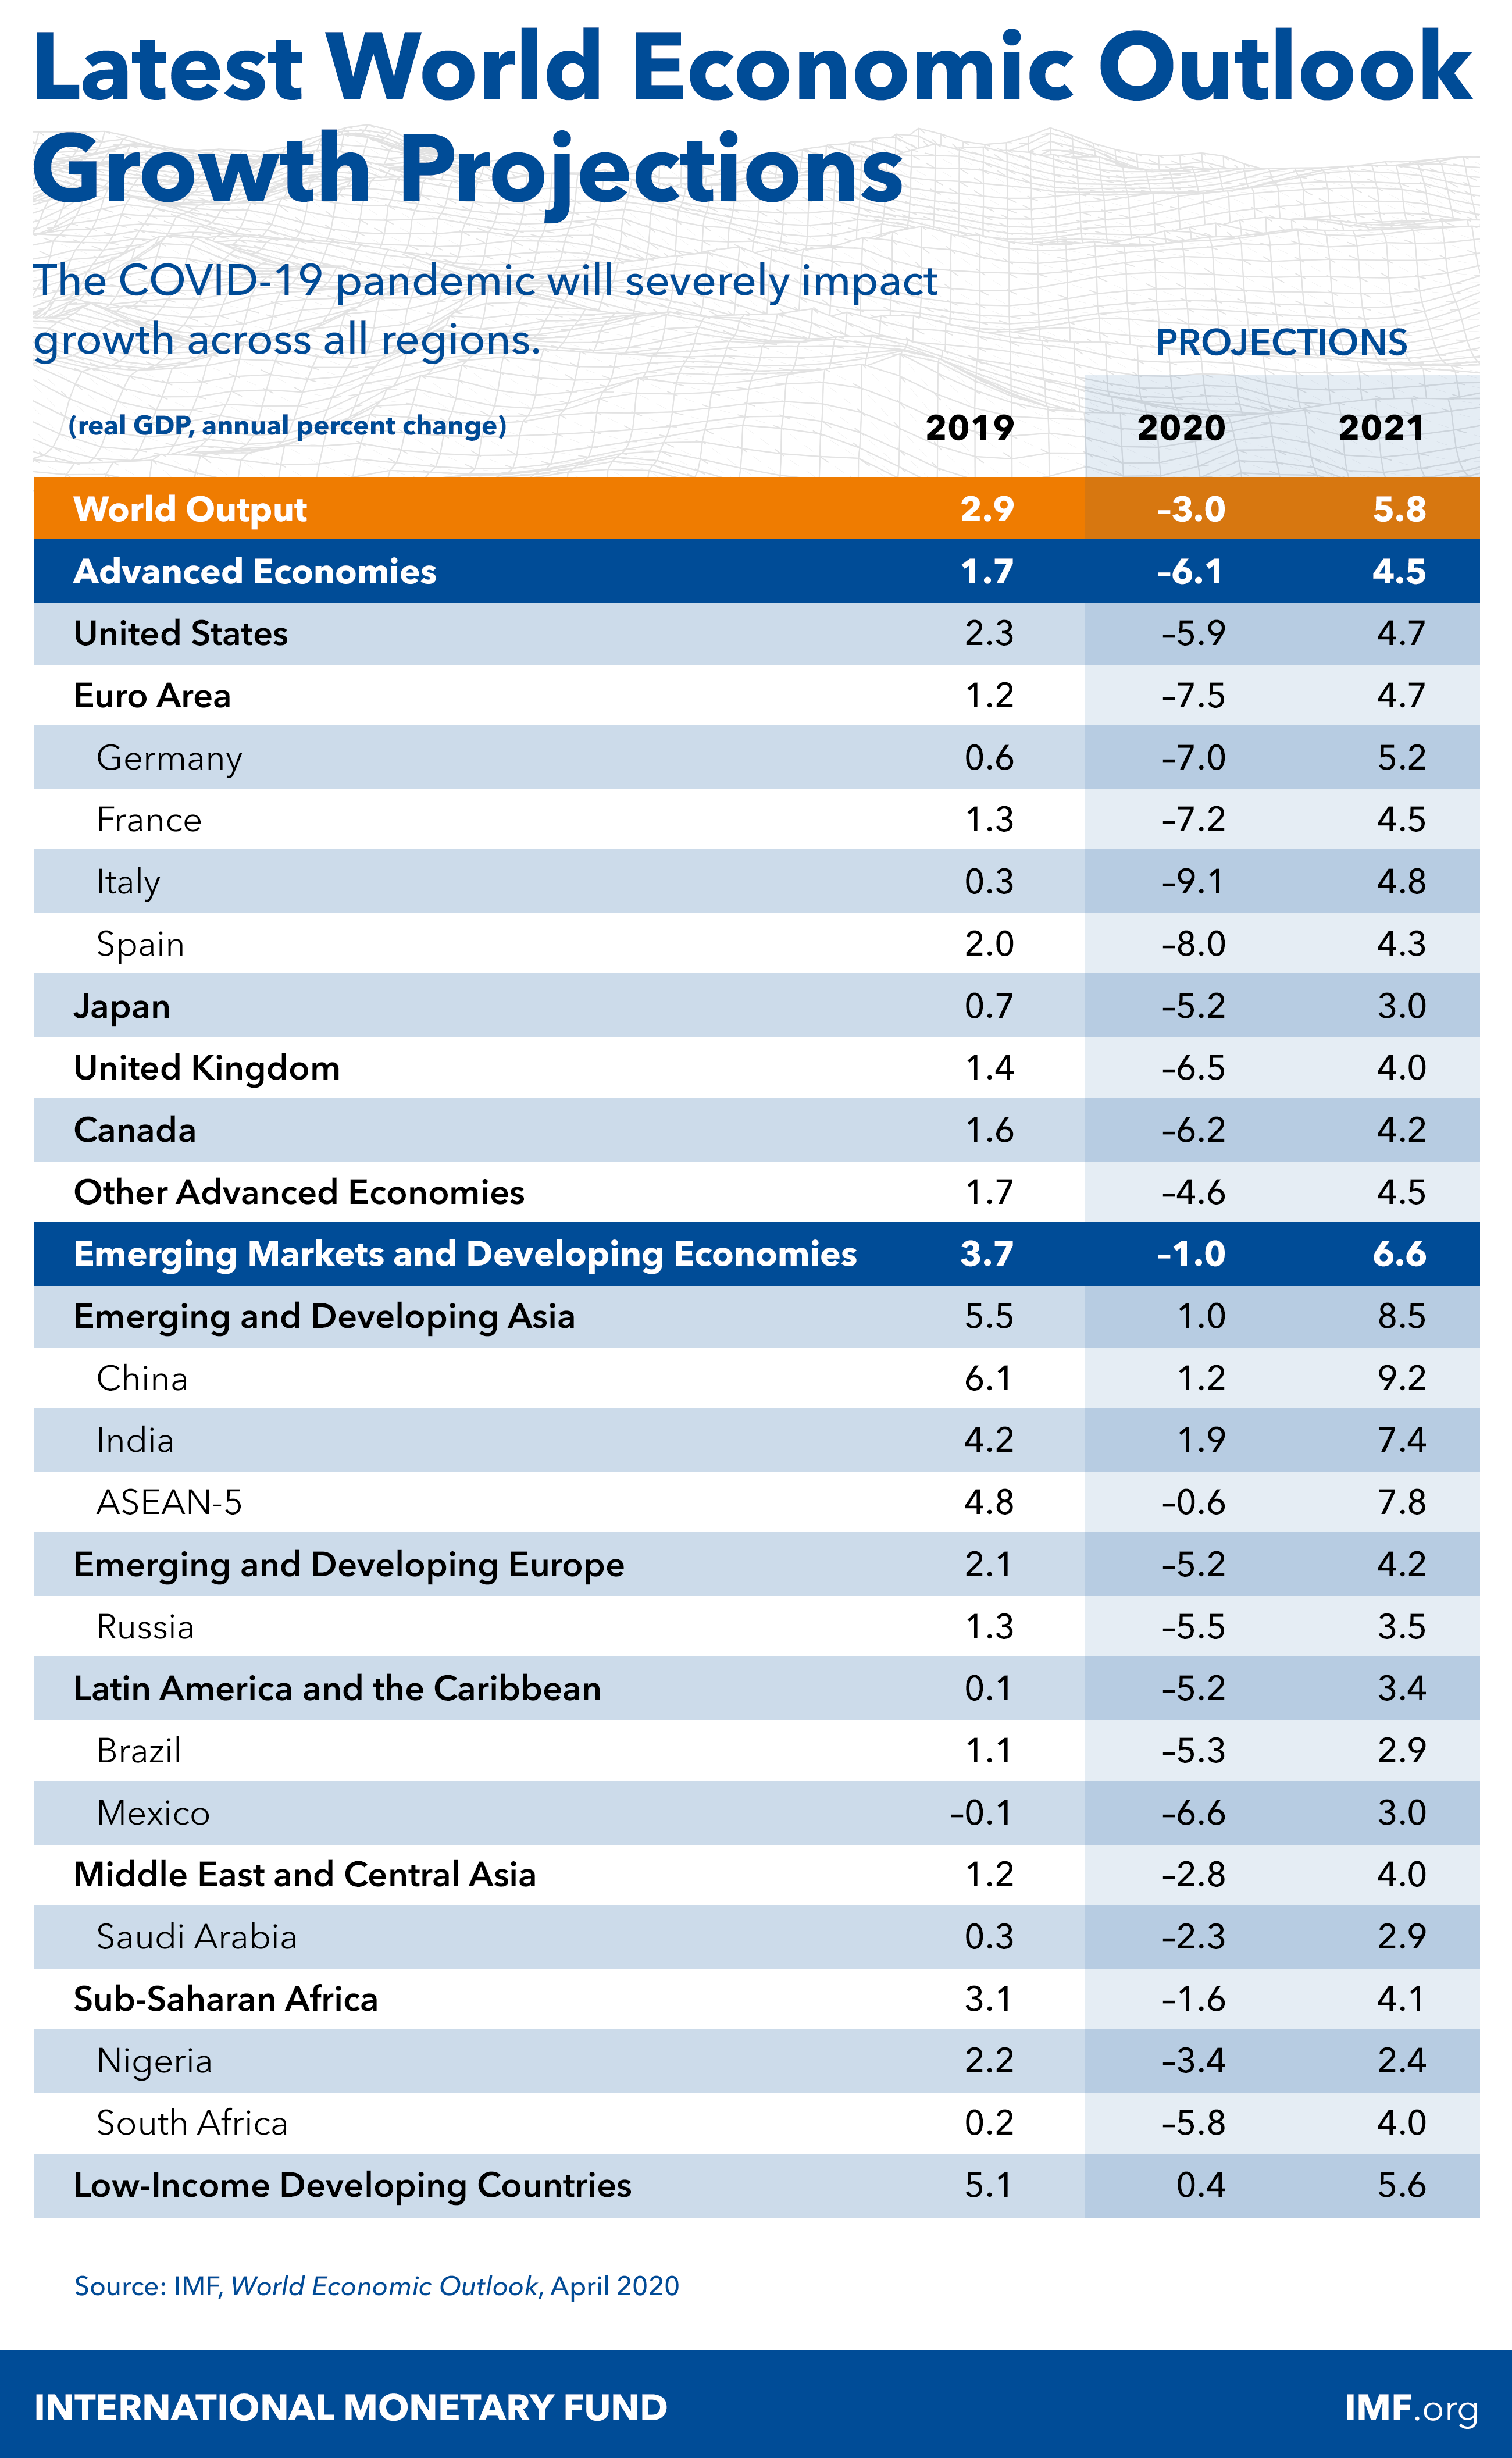
Grafen herover viser IMFs prognose for væksten i udvalgte områder og lande i 2020 og 2021.
Kapitel 1 af den nye rapport er indtil videre udgivet og kan downloades ved at klikke på billedet herunder:

Posted af John Yde, 02/04/2020

Det canadiske handelsunderskud svandt ind til lige under 1 mia. CAD i februar (de rød/grønne søjler).
Det canadiske handelsunderskud svandt ind til lige under 1 mia.... Læs merePosted af John Yde, 02/04/2020
Posted af John Yde, 02/04/2020

Det canadiske PMI index faldt til 46,1 i marts (den hvide kurve).
Det canadiske PMI index faldt til 46,1 i marts (den... Læs merePosted af John Yde, 31/03/2020

Canada er stadigvæk et af de få lande, der udregner månedlige tal for bruttonationalproduktet. I januar var væksten i den canadiske økonomi på 0,1% (de gule søjler), og det betød et mindre dyk i den årlige vækstrate til 1,8% (den hvide kurve).
Canada er stadigvæk et af de få lande, der udregner... Læs mere